import pandas as pd
import numpy as np
import matplotlib.pyplot as plt


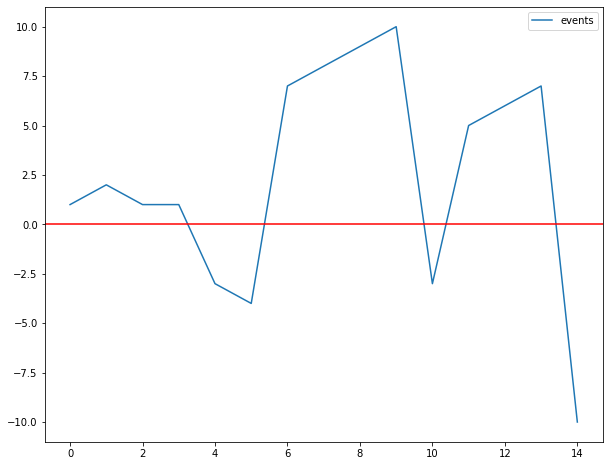
df = pd.DataFrame({"events": [1,2,1,1,-3,-4,7,8,9,10,-3,5,6,7,-10]})
df.plot(figsize = (10,8))
plt.axhline(y = 0, c = 'r')
plt.show()

df["sign"]=np.sign(df.events)
df['diff_sign'] = df.sign.diff()
df["change"]=np.cumsum(df.sign.diff() != 0)
df
| events | sign | diff_sign | change | |
|---|---|---|---|---|
| 0 | 1 | 1 | NaN | 1 |
| 1 | 2 | 1 | 0.0 | 1 |
| 2 | 1 | 1 | 0.0 | 1 |
| 3 | 1 | 1 | 0.0 | 1 |
| 4 | -3 | -1 | -2.0 | 2 |
| 5 | -4 | -1 | 0.0 | 2 |
| 6 | 7 | 1 | 2.0 | 3 |
| 7 | 8 | 1 | 0.0 | 3 |
| 8 | 9 | 1 | 0.0 | 3 |
| 9 | 10 | 1 | 0.0 | 3 |
| 10 | -3 | -1 | -2.0 | 4 |
| 11 | 5 | 1 | 2.0 | 5 |
| 12 | 6 | 1 | 0.0 | 5 |
| 13 | 7 | 1 | 0.0 | 5 |
| 14 | -10 | -1 | -2.0 | 6 |
df["change"]=np.cumsum(df.sign.diff() != 0)
valores = df.groupby("change").events.transform(lambda x: x.abs().max())*df.sign
valores
0      2
1      2
2      2
3      2
4     -4
5     -4
6     10
7     10
8     10
9     10
10    -3
11     7
12     7
13     7
14   -10
dtype: int64
mask = (df.events == valores).mask(lambda x: x == 0, np.nan)
df.events*mask
0      NaN
1      2.0
2      NaN
3      NaN
4      NaN
5     -4.0
6      NaN
7      NaN
8      NaN
9     10.0
10    -3.0
11     NaN
12     NaN
13     7.0
14   -10.0
dtype: float64
df.events.plot(figsize = (10,8))
plt.axhline(y = 0, c = 'r')
plt.plot(df.events*mask, 'o', c = 'k')
plt.show()
